This is part of a series of posts sharing some of the research material I collected while researching my book How to Write Light Novels and Webnovels. There was a lot I found that I couldn’t fit into the book, so I thought I’d share it here.The categories listed are translations of the ones the sites use, not my own categories.
Since I had data from three different Korean webfiction sites of Joara, Naver and Munpia, it only seemed logical to combine them to see what was really popular. I used the percentages from each (since the actual numbers would have skewed things) and created a graph.
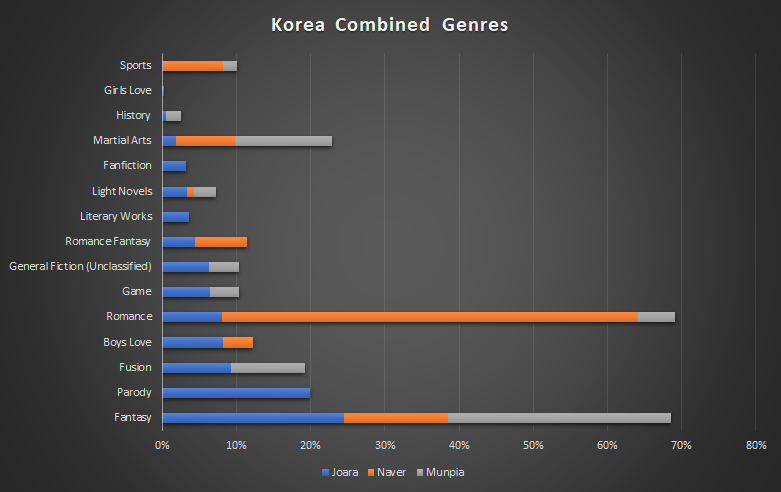
In the end, the combined chart isn’t much different than the regular charts, Romance wins by a hair over Fantasy, and everything else trails behind. I suppose if I added Martial Arts and Fusion to Fantasy, then Fantasy would win. However, not by much since then I’d have to add Romance Fantasy, Boys Love, and Girls Love to Romance.
| Genre | Joara | Naver | Munpia |
| Fantasy | 25% | 14% | 30% |
| Parody | 20% | ||
| Fusion | 9% | 10% | |
| Boys Love | 8% | 4% | |
| Romance | 8% | 56% | 5% |
| Game | 6% | 4% | |
| General Fiction (Unclassified) | 6% | 4% | |
| Romance Fantasy | 4% | 7% | |
| Literary Works | 4% | ||
| Light Novels | 3% | 1% | 3% |
| Fanfiction | 3% | ||
| Martial Arts | 2% | 8% | 13% |
| History | 1% | 2% | |
| Girls Love | 0% | ||
| Sports | 0% | 8% | 2% |
Yes, the percentages don’t quite add up, this is because not all sites have the same genres and I used the Joara genres as the base. It still gives a pretty good sample, I think.